Oregon's real estate market exhibited a mixed landscape in August. While new listings decreased month-over-month, overall inventory remains high and buyer interest continues to climb. Prices showed slight declines from July but edged higher compared to last year, underscoring the market’s enduring strength.
 |
| August 2025 shows a softening in new listings and prices relative to July, but the year-over-year increases tell a more nuanced story—market activity remains healthier than a year ago. |
Oregon Real Estate Market Snapshot – August 2025 (All RMLS Areas)
Key Takeaways
-
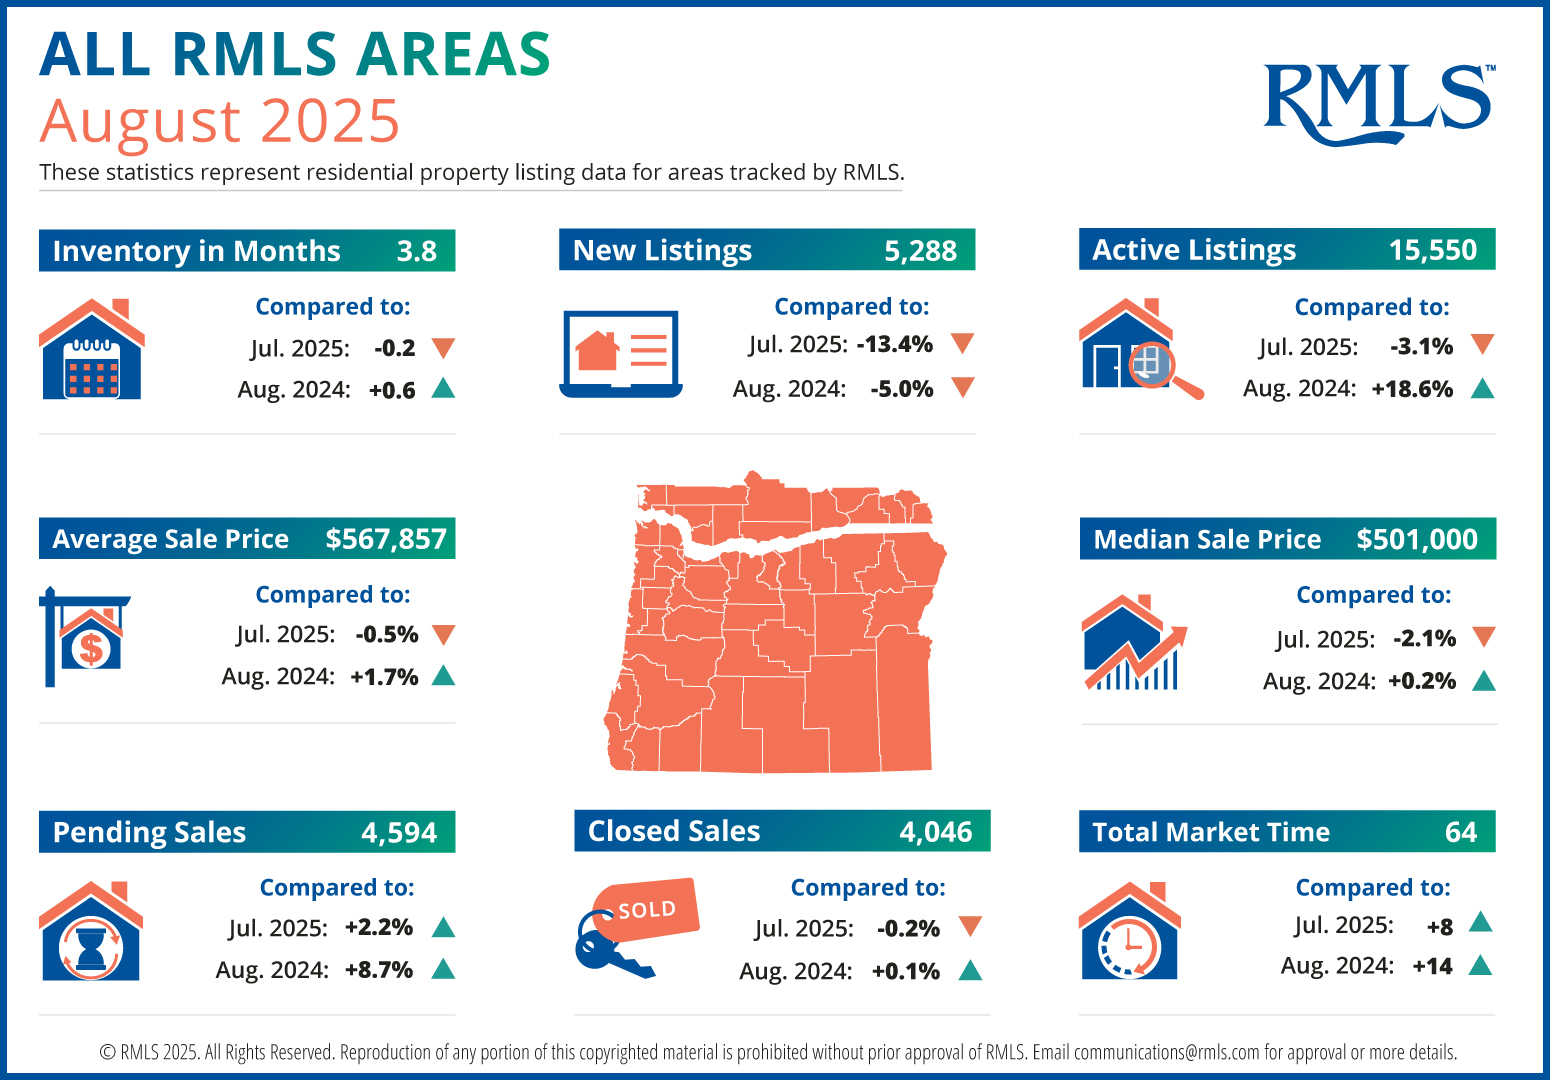
Inventory: At 3.8 months, inventory ticked down slightly from July (–0.2) but remains above last year’s August (+0.6). This suggests that while some sluggishness continues, overall availability has increased year-over-year.
-
New Listings: There were 5,288 new listings, a notable –13.4% drop from July and –5.0% lower than August 2024, indicating a pullback in new supply entering the market.
-
Active Listings: With 15,550 homes actively listed, this figure dipped 3.1% from July but stands 18.6% higher year-over-year, implying a more substantial market presence compared to 2024.
-
Pending Sales: At 4,594, pending sales edged up 2.2% from July and surged 8.7% compared to August 2024, signaling steady buyer engagement.
-
Closed Sales: Closed transactions totaled 4,046, nearly flat compared to July (–0.2%) and slightly above August 2024 (+0.1%), denoting consistent completion rates.
-
Prices:
-
Average Sale Price: $567,857, slightly down from July (–0.5%) but up 1.7% vs. August 2024.
-
Median Sale Price: $501,000, down 2.1% from July, yet up 0.2% year-over-year.
-
Total Market Time: Homes are now spending an average of 64 days on the market, which is 8 days longer than July and 14 days longer than last August, indicating slower transaction velocity.
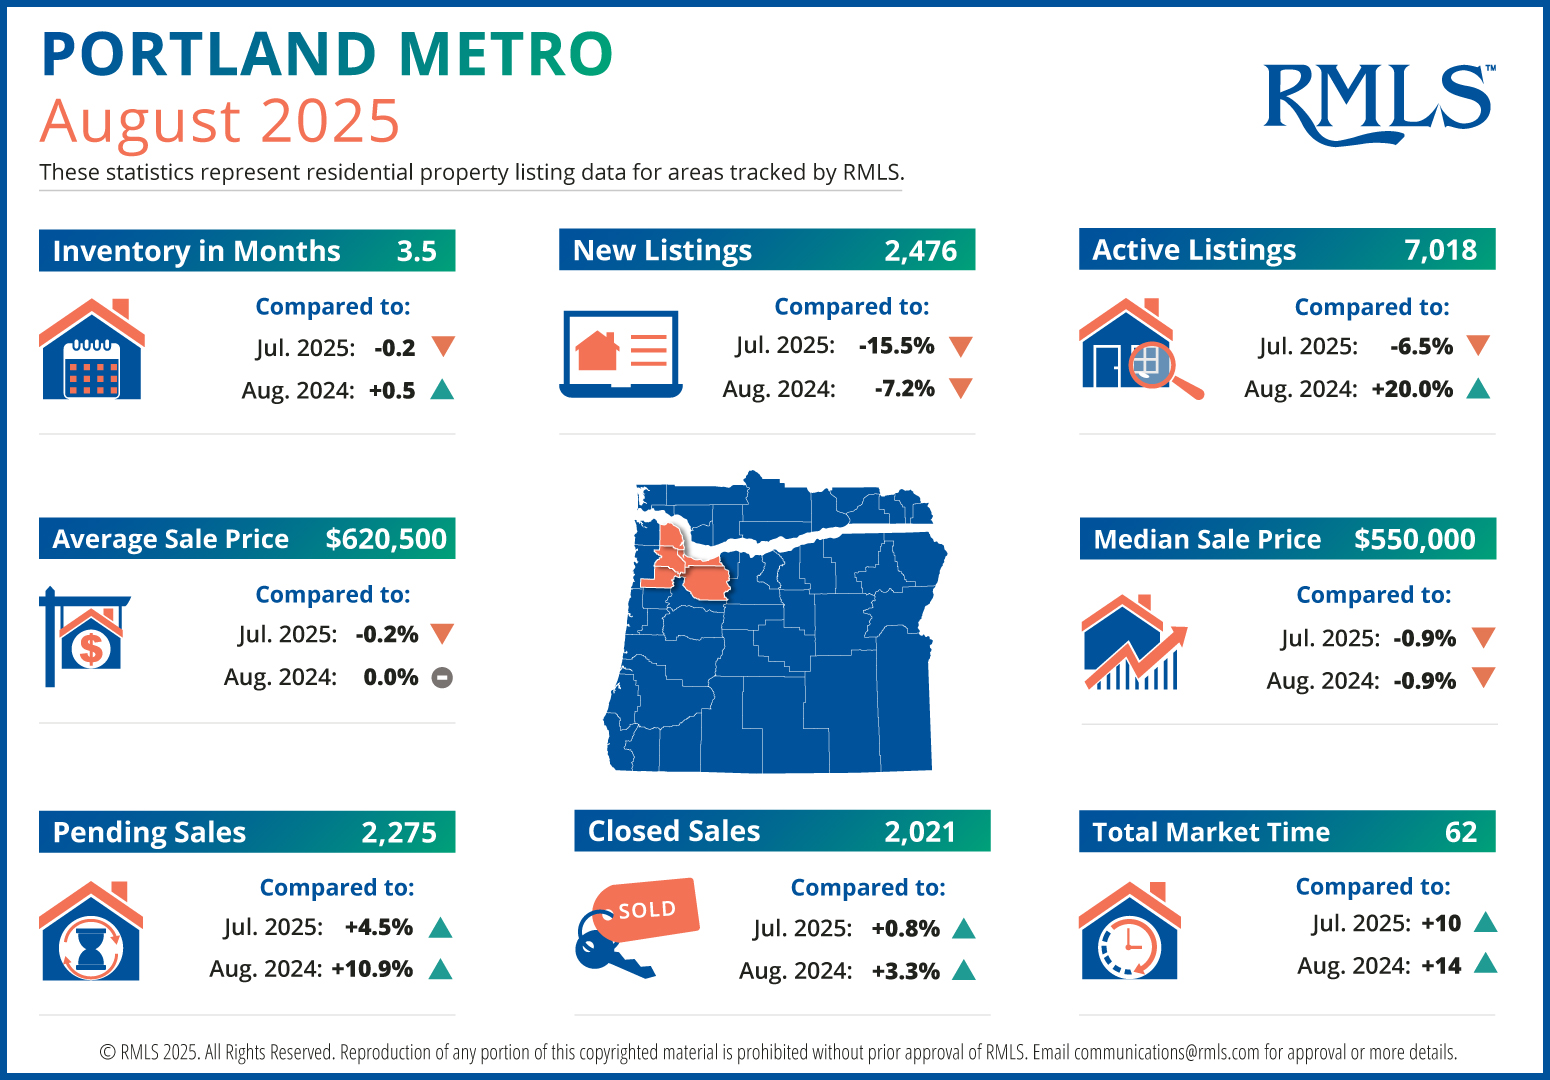
Portland’s market mirrors—but also sharpens—the statewide trends. Though new listings plunged more steeply in August (–15.5% vs. –13.4% statewide), active inventory remains elevated (+20% year‑over‑year), offering buyers more choices than in previous years. Prices in Portland held steady—especially the average sale price—while both pending and closed sales are trending upward. Homes, however, are staying on the market longer (62 days), reinforcing a shift toward buyer‑leverage and more deliberate purchasing.
How Portland Compares to the Broader Oregon Market
| Metric | Oregon (RMLS All Areas) | Portland Metro | Insight |
|---|
| Inventory | ~3.8 months | 3.5 months | Portland slightly tighter. |
| New Listings | 5,288 | 2,476 | Both saw a drop, but Portland's drop is steeper. |
| Active Listings | 15,550 | 7,018 | Similar year‑over‑year growth. |
| Price Trends | Avg $567K, Med $501K | Avg $620K, Med $550K | Portland remains pricier overall. |
| Pending & Closed Sales | Modest growth | Stronger growth | Portland shows more sales momentum. |
| Market Time | 64 days | 62 days | Both markets cooling, with reflective buyer behavior. |
Why This Matters for Locals
-
Increased Buyer Leverage
With inventory on the rise and longer market times, well‑priced property and savvy negotiation are key.
-
Sales Activity Shows Resilience
Despite fewer new listings, strong pending and closed sales suggest continued demand among motivated buyers.
-
Pricing Plateaus
Unlike statewide modest gains, Portland’s average price held firm and median dipped slightly—indicating a stabilizing market rather than a surge.
-
More Time to Decide
Buyers now have breathing room—62 days is significantly longer than mid‑summer norms—emphasizing the value of timing and pricing strategy.
Wrap-Up: Navigating a Shifting Market
August 2025 painted a picture of a market in transition across Oregon—and especially in the Portland metro area. While new listings declined, inventory remains higher than a year ago, giving buyers more breathing room. Sales activity continues to show strength, and prices are largely holding steady despite longer market times. For sellers, this means pricing and presentation are more important than ever. For buyers, the tide is turning in your favor—but competition for well-priced homes is still real. As we move into the fall season, expect a market defined by balance, strategy, and opportunity for those ready to act.


Comments
Post a Comment